美签经常被 check 的朋友想必很熟悉 https://www.checkee.info (一个报 check DP 的网站) ![]()
最近在纠结要不要回国签证,看到不少讨论说十月政府关门导致 check 时间大幅上涨,但 checkee.info 自带的分析不太容易看 week-over-week, month-over-month 的趋势,遂简单 vibe 了几个 script 扒拉下数据画了点图。
本帖使用的一些 definition/assumption:
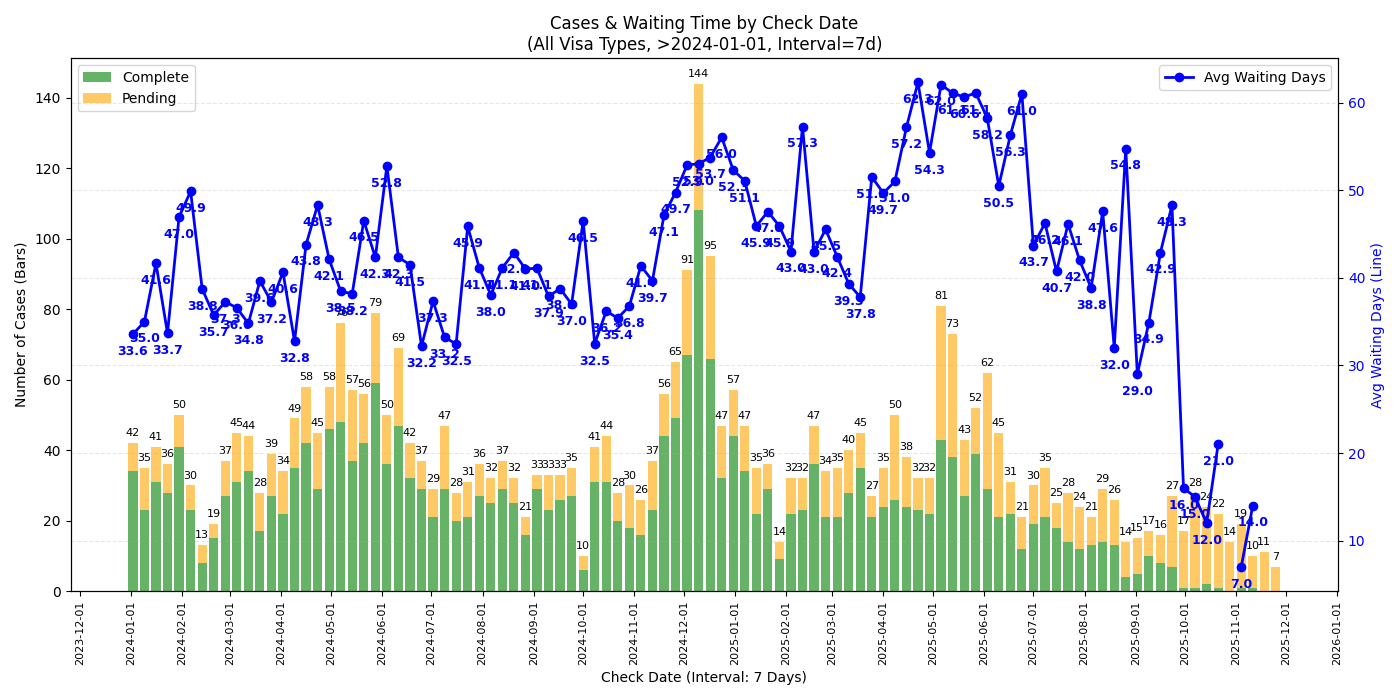
- Check date 是指面签时间,Complete date 是指 check 完成的时间,Waiting time 指两者的 diff(都同 checkee.info 的定义),还在 pending 的 case 没有 complete date 故不体现在 waiting time 的折线图里
- 舍弃 check 时长(waiting time)小于 7d 的数据,个人猜测大都是直接 approve 后正常的处理时间
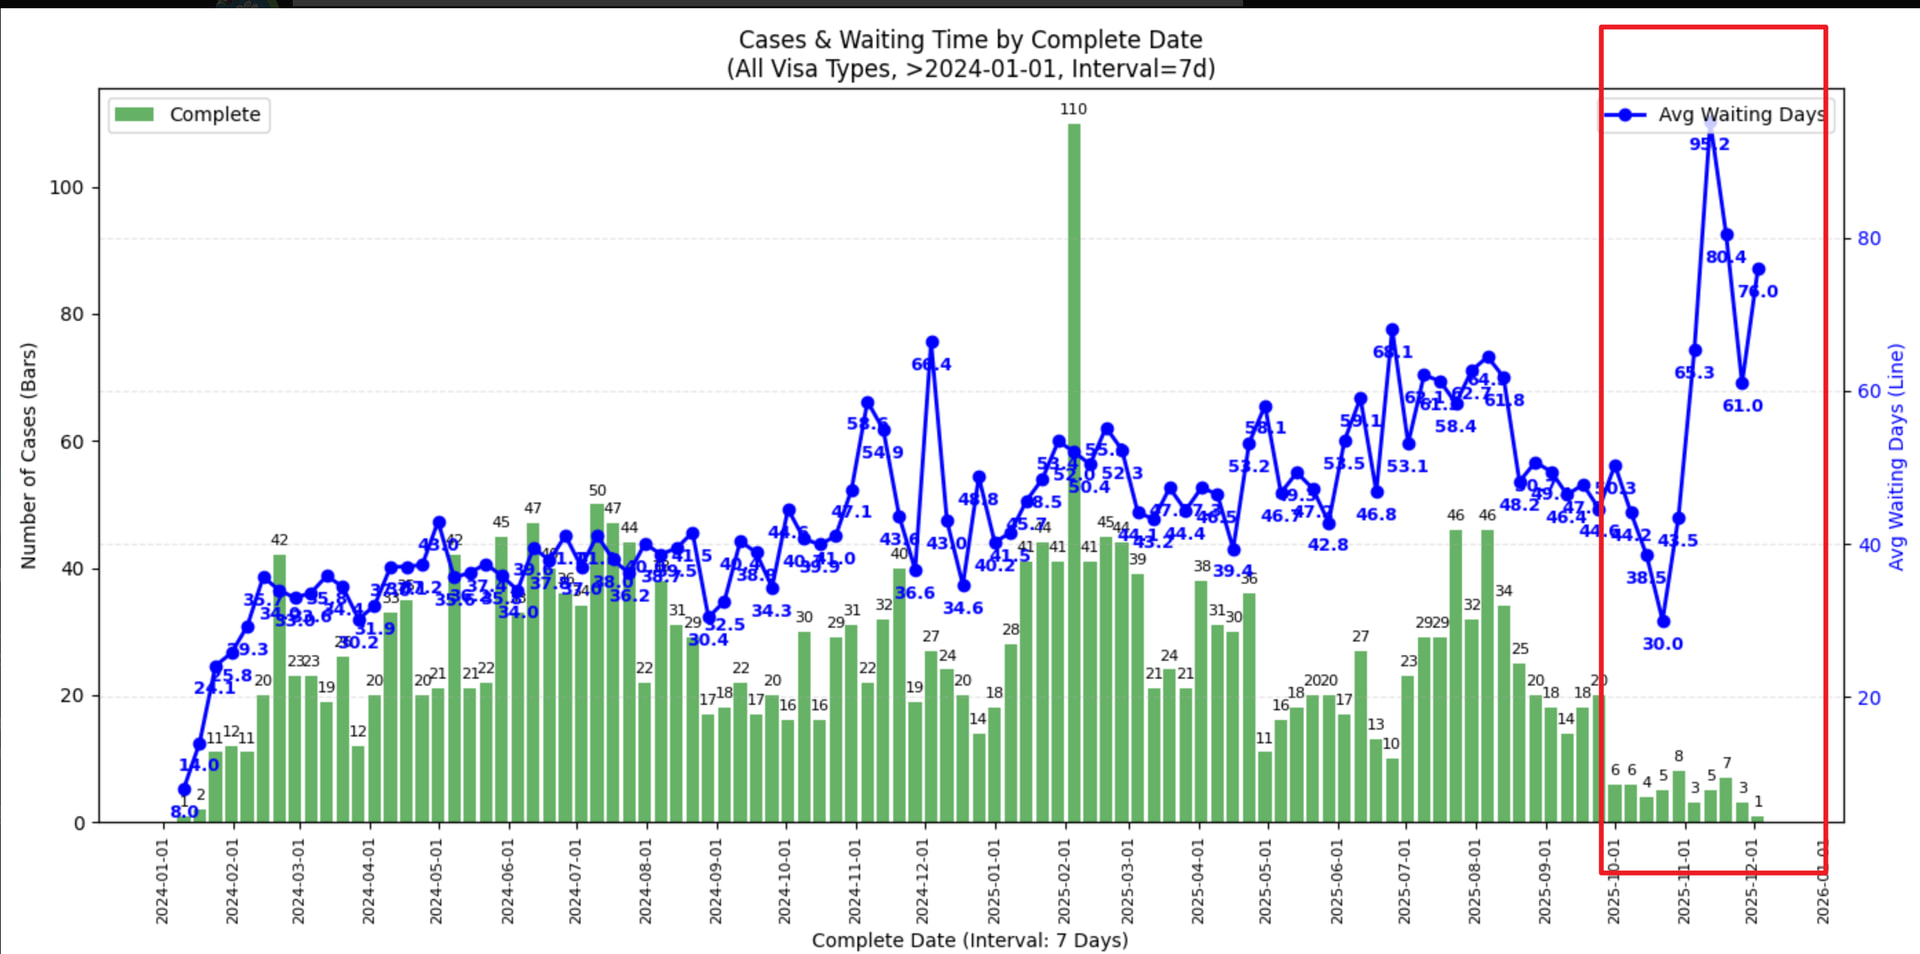
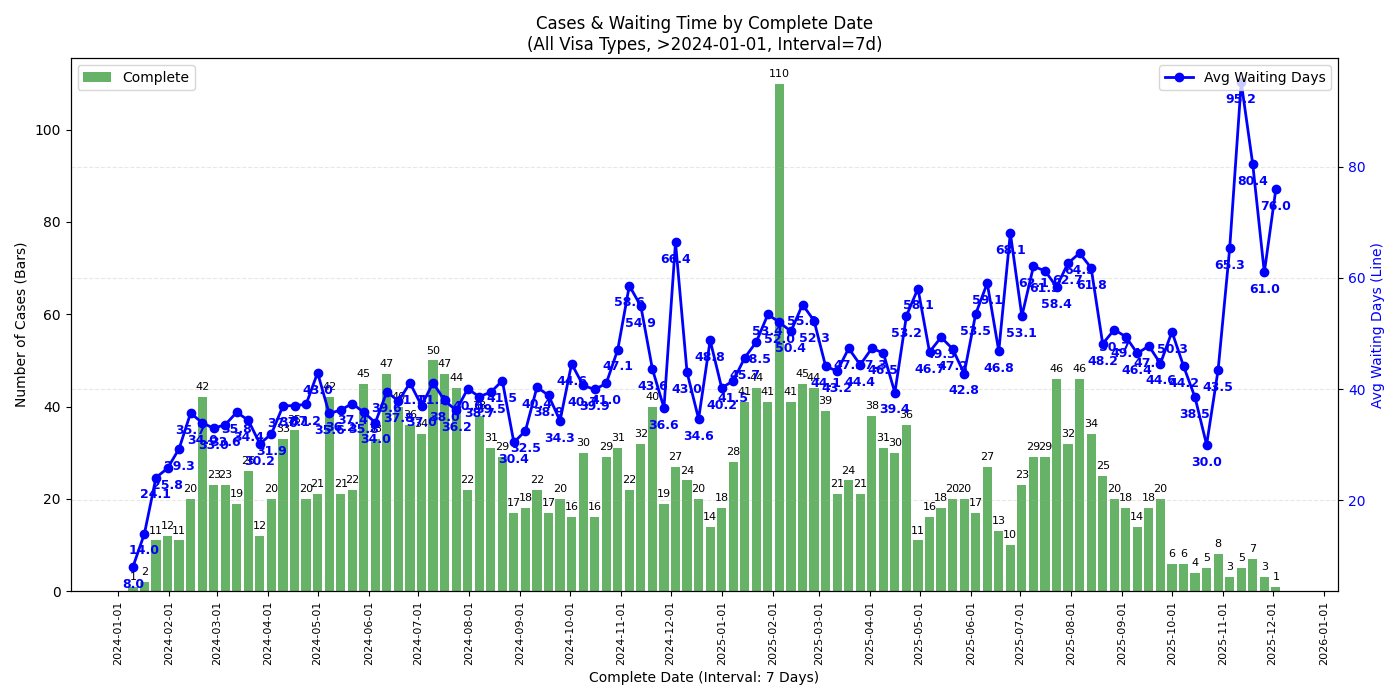
- x 轴是 complete date 的图都只考虑 completed case 不考虑 pending case
- 数据范围是 2024-01-01 到 2025-12-02,数据更新至 2025-12-02
- 在此范围内一共有 3800 条数据,其中 H1 约 1100 条,F1/J1 加起来约 1800 条
- 并非所有人都会把自己的 DP 贴到这个网站上,因此以下的分析只能代表 checkee.info 网站上的 DP。本站也有 H1B 面签的 DP 帖 开一个新政后H1B面签的dp楼
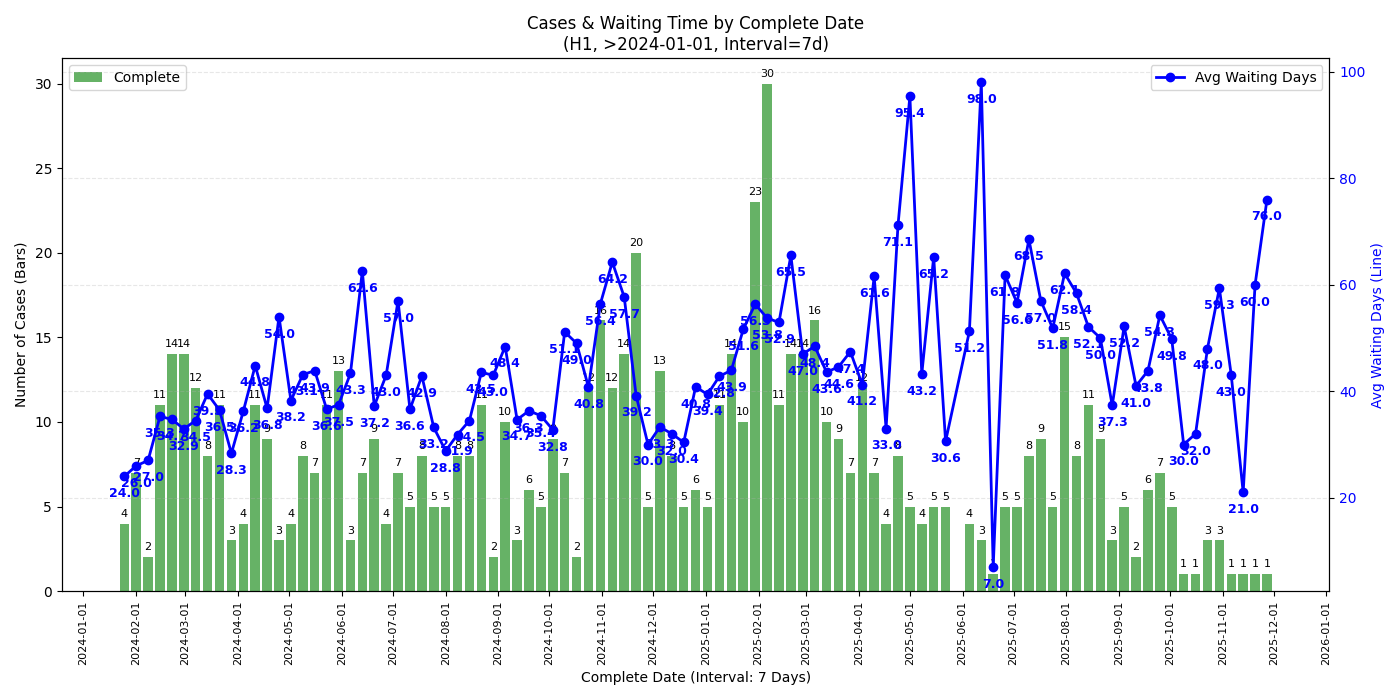
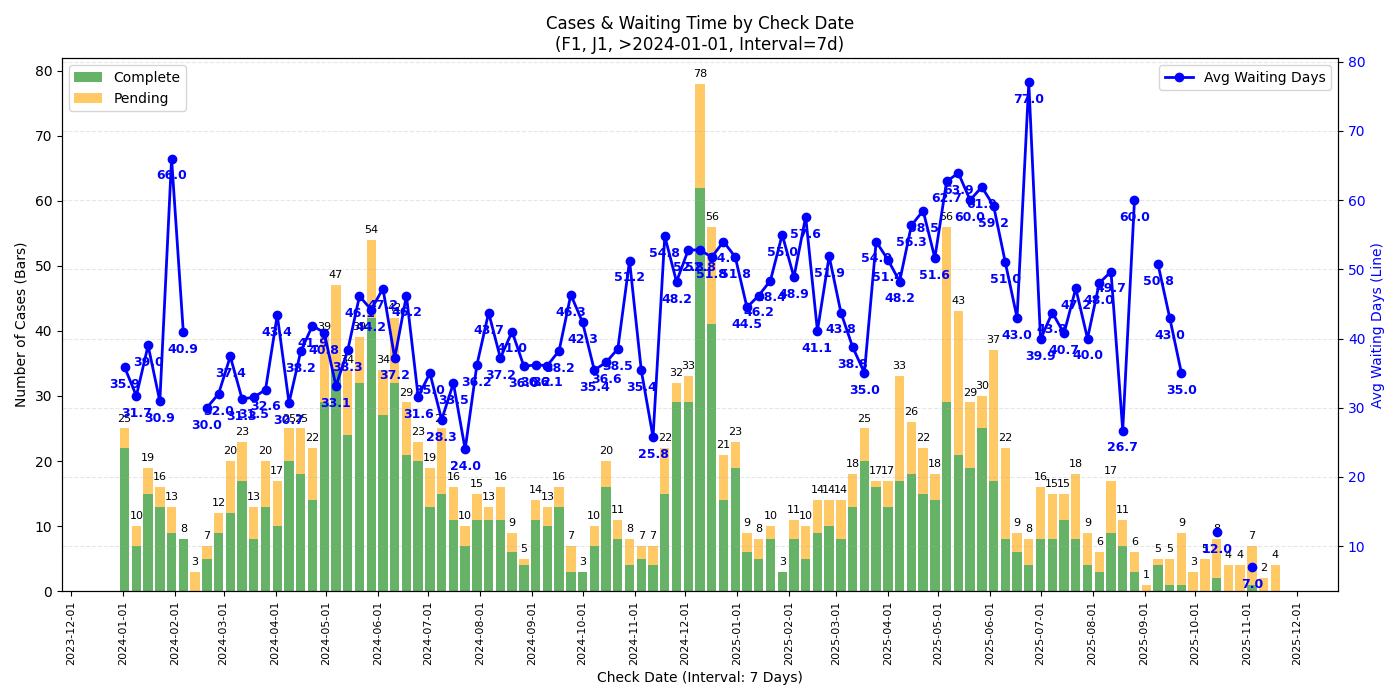
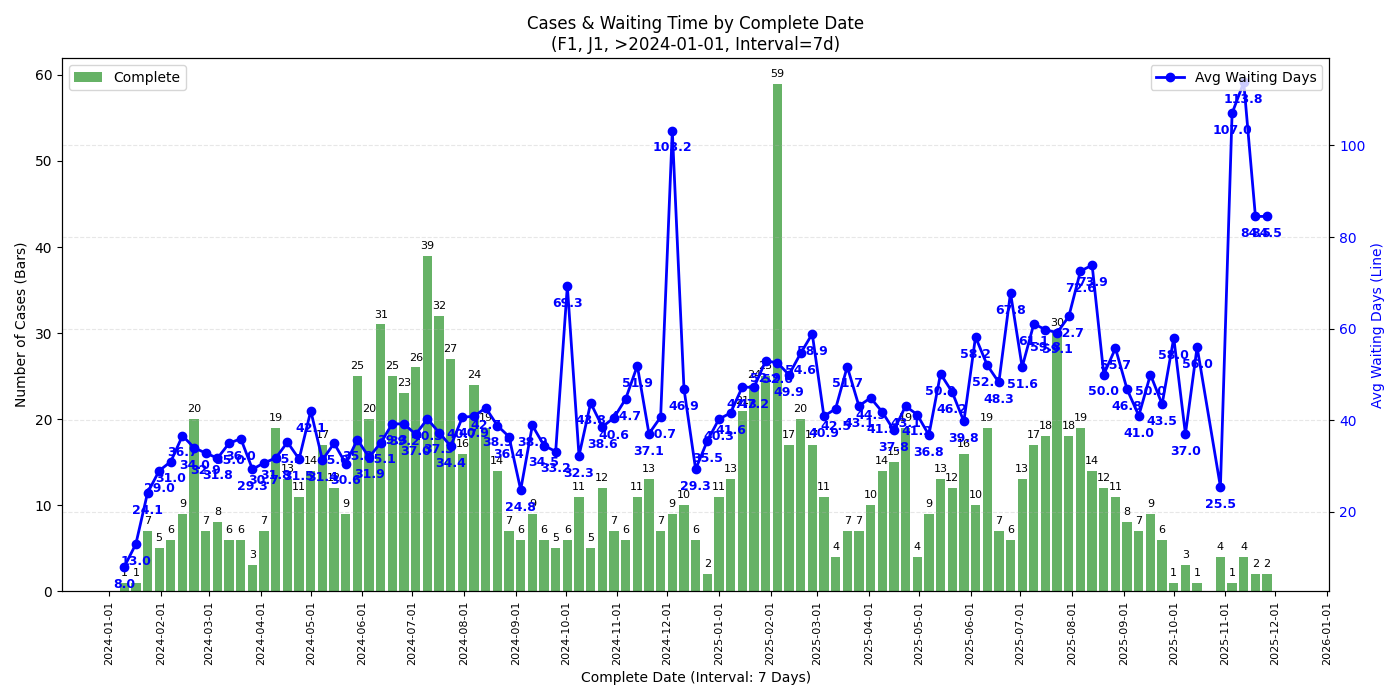
7 天趋势 (week-over-week)
所有签证类型
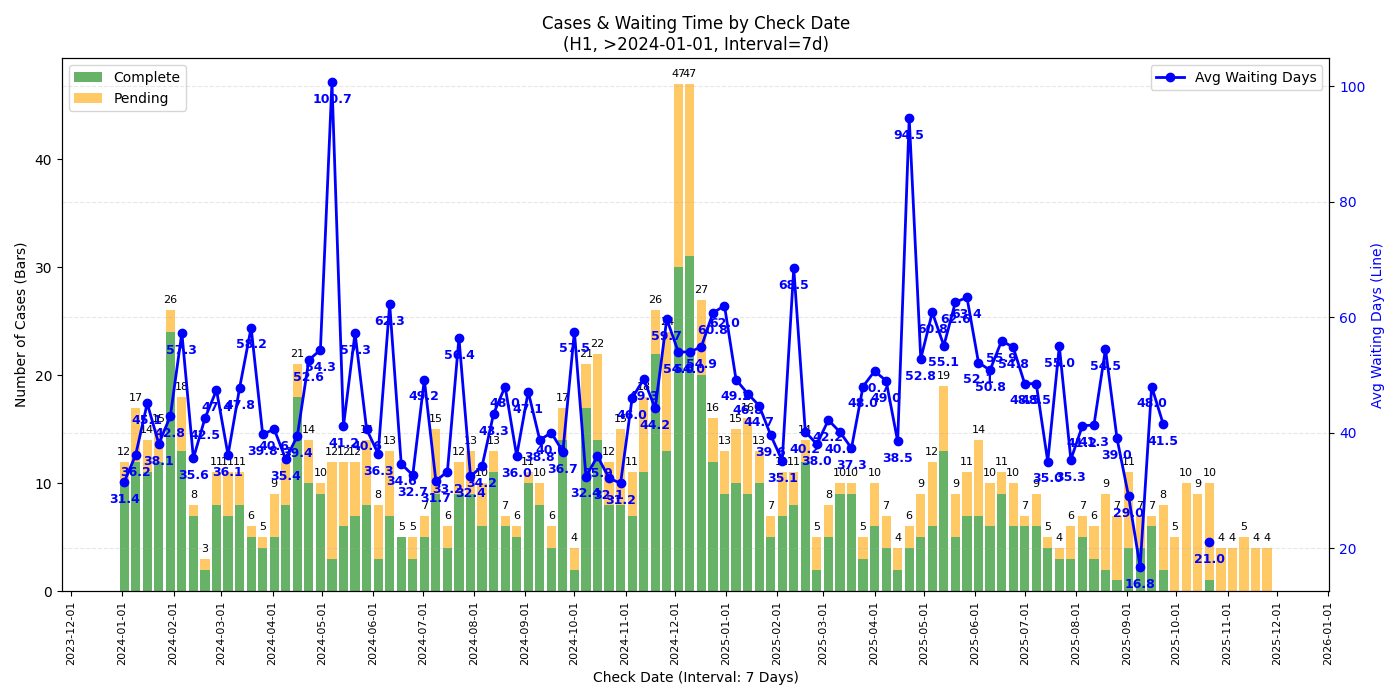
H1
F1 & J1
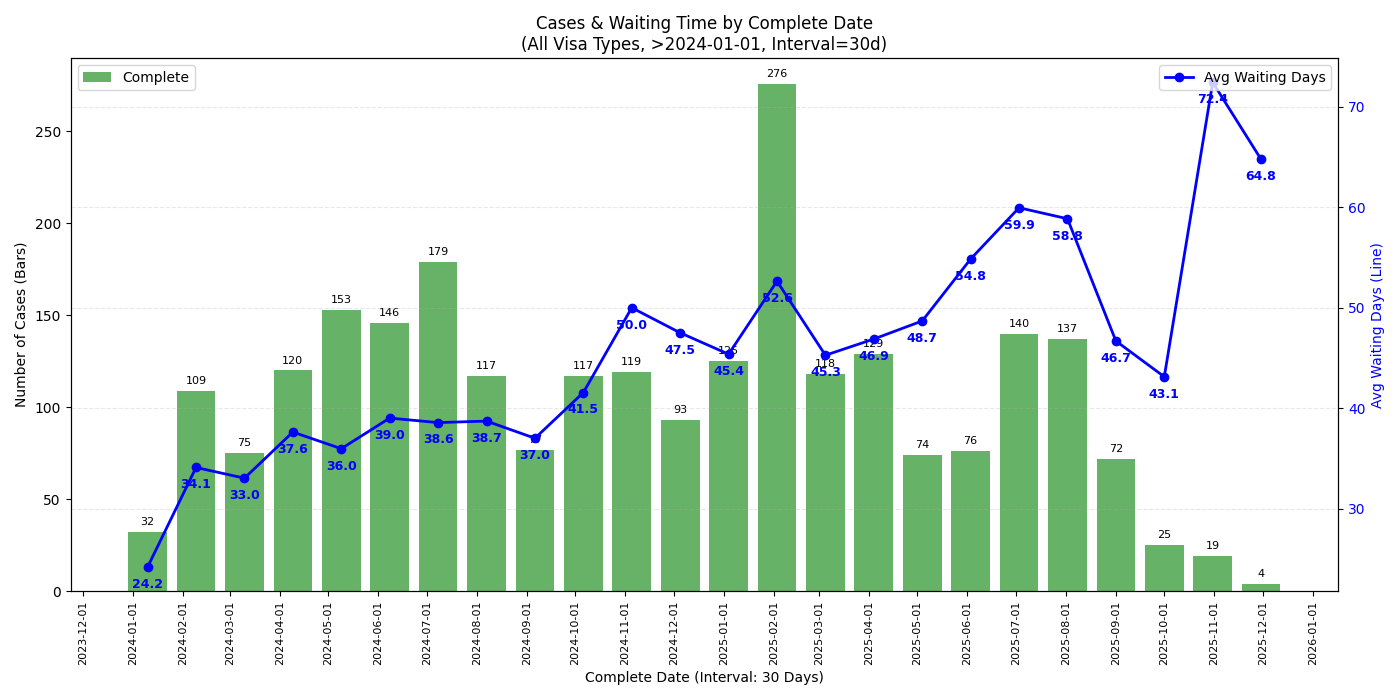
30 天趋势 (month-over-month)
所有签证类型

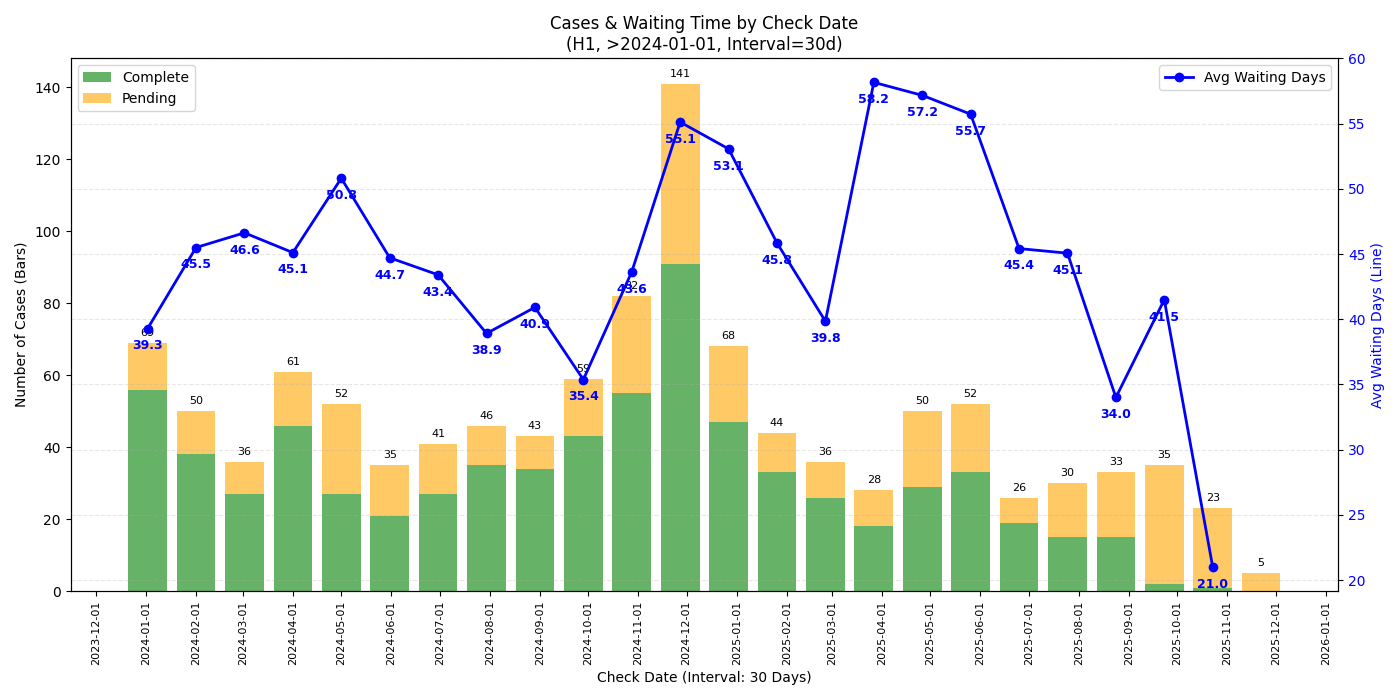
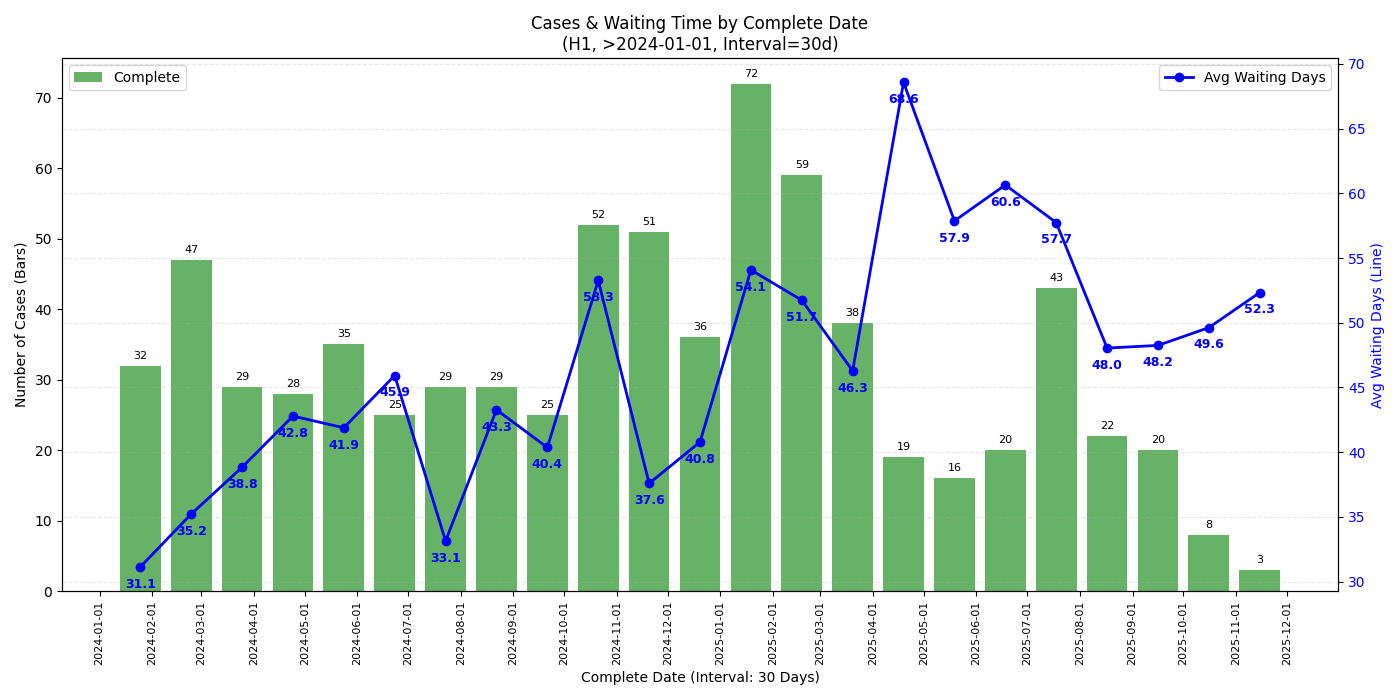
H1
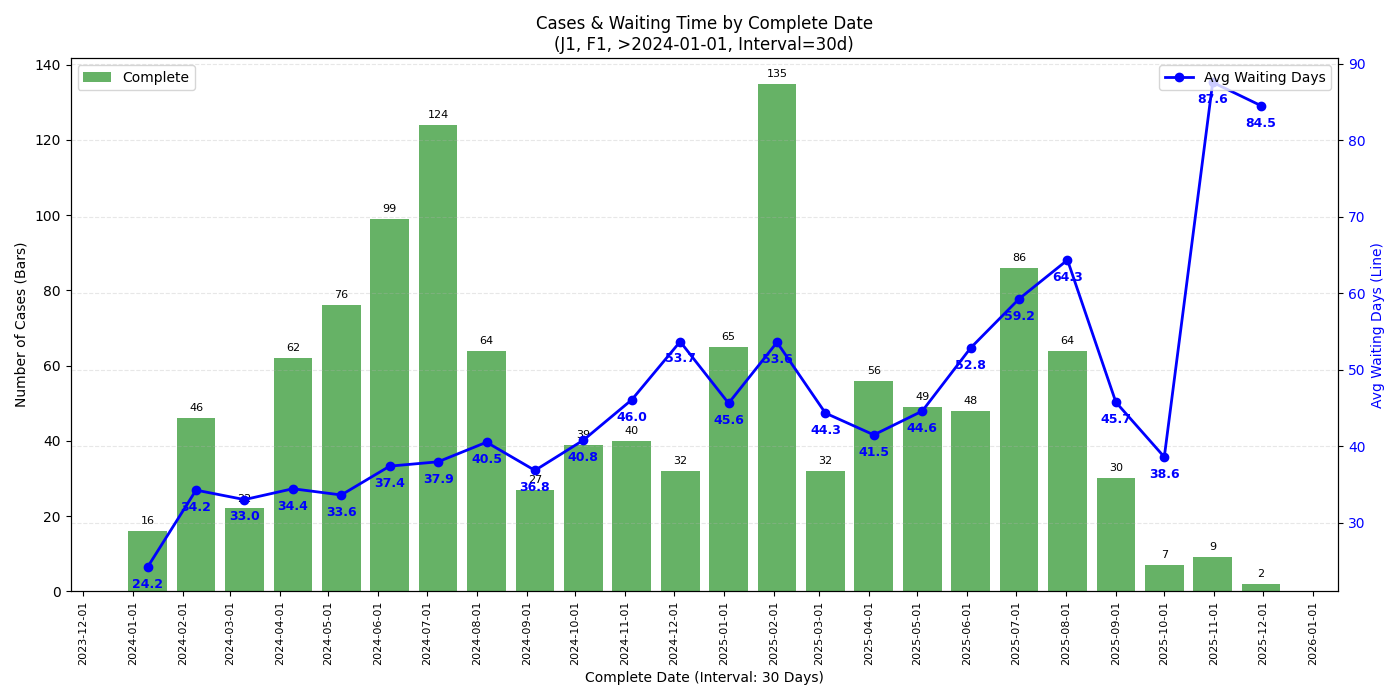
F1 & J1
个人观察
- 观察近期趋势的话单独某个签证类型的数据量太小,可能看所有签证类型的比较有意义
- 从 complete date 的图来看,最近 check 完成的 case (2025/11 中旬以后) check 时长确实有一个不小的上升,似乎有下降趋势但不知接下来的圣诞假期是否会再度上涨
- 从 check date 的图来看 2025/09 的 case 并没有见到太过异常的等待时间,可能跟还有不少 pending case 有关
- 若是年底回去签证建议留足时间 (还是祝福潭友能秒过),不知道一月底可能的二次关门是否会再度影响
Appendix
本帖思路就是把 case details (e.g. Check Reporter) 爬下来放到 csv 文件里,做一下 filter 并 plot 出来。爬的脚本和数据不确定是否有版权或隐私问题就不贴了,让 LLM vibe 一个应该花不了几分钟,留给读者作为练习 ![]() 。用于 visualize 的脚本贴在此处供参考,如果潭友还需要画别的图又懒得自己扒数据欢迎评论我尽量画一画
。用于 visualize 的脚本贴在此处供参考,如果潭友还需要画别的图又懒得自己扒数据欢迎评论我尽量画一画
visualize.py
import pandas as pd
import matplotlib.pyplot as plt
import matplotlib.dates as mdates
import seaborn as sns
import numpy as np
import os
import re

# --- Configuration ---
# Visa Groups to analyze
VISA_GROUPS_TO_ANALYZE = [
    {'H1'},          # Only H1
    {'F1', 'J1'},
    'ALL'            # All visa types
]

OUTPUT_DIR = 'plots'
MIN_WAITING_DAYS = 7        # Filter out complete cases with fewer than this many days
START_DATE = '2024-01-01'   # Discard records with dates before this
END_DATE = '2026-01-01'     # Discard records with dates after this
INTERVAL_DAYS = 30           # Grouping interval in days (e.g., 7 for weekly, 30 for monthly)

def load_and_clean_data(filepath):
    """
    Loads data from Excel (.xlsx) or CSV.
    Prioritizes Excel reading based on user instruction.
    """
    if not os.path.exists(filepath):
        print(f"Error: File '{filepath}' not found.")
        return None

    df = None

    try:
        # Check extension to decide loader, but default to Excel if ambiguous or xlsx
        if filepath.endswith('.xlsx'):
            print(f"Attempting to read '{filepath}' as Excel file...")
            df = pd.read_excel(filepath, engine='openpyxl')
        else:
            # Fallback for CSV
            print(f"Attempting to read '{filepath}' as CSV...")
            for encoding in ['utf-8', 'gb18030', 'latin1']:
                try:
                    df = pd.read_csv(filepath, encoding=encoding)
                    break
                except:
                    continue
    except Exception as e:
        print(f"Error loading file: {e}")
        return None

    if df is None:
        print("Failed to load data into DataFrame.")
        return None

    # --- Data Cleaning ---
    df.columns = df.columns.str.strip()

    required_cols = ['Check Date', 'Complete Date', 'Visa Type']
    missing_cols = [c for c in required_cols if c not in df.columns]
    if missing_cols:
        print(f"Error: Missing required columns: {missing_cols}")
        return None

    df['Check Date'] = df['Check Date'].astype(str).str.strip()
    df['Complete Date'] = df['Complete Date'].astype(str).str.strip()

    # Determine Status
    df['Case Status'] = 'Complete'
    df.loc[df['Complete Date'].str.contains('0000-00-00', na=False), 'Case Status'] = 'Pending'

    # Parse Dates
    df['Check Date Obj'] = pd.to_datetime(df['Check Date'], errors='coerce')
    df['Complete Date Obj'] = pd.to_datetime(df['Complete Date'], errors='coerce')

    # Drop invalid check dates
    df = df.dropna(subset=['Check Date Obj'])

    # --- 1. Date Filtering (Start & End Date) ---
    # Discard if Check Date OR Complete Date is outside the [START_DATE, END_DATE] range
    start_dt = pd.to_datetime(START_DATE)
    end_dt = pd.to_datetime(END_DATE)

    # Condition: Check Date must be within range
    check_date_valid = (df['Check Date Obj'] >= start_dt) & (df['Check Date Obj'] <= end_dt)

    # Condition: If complete, Complete Date must be within range
    # (Pending cases have NaT/invalid Complete Date, so we ignore them in this specific check)
    complete_date_valid = (df['Complete Date Obj'] >= start_dt) & (df['Complete Date Obj'] <= end_dt)

    # Logic: Keep if (Valid Check Date) AND (If Complete -> Valid Complete Date)
    # Keep = (Check in Range) AND (Status==Pending OR Complete in Range)
    final_date_mask = check_date_valid & ((df['Case Status'] == 'Pending') | complete_date_valid)

    before_len = len(df)
    df = df[final_date_mask].copy()
    dropped_dates = before_len - len(df)
    if dropped_dates > 0:
        print(f"Dropped {dropped_dates} records outside date range {START_DATE} to {END_DATE}.")

    # Calculate Waiting Days (Complete cases only)
    df['Waiting Days'] = (df['Complete Date Obj'] - df['Check Date Obj']).dt.days

    # Filter out negative waiting days
    df.loc[(df['Case Status'] == 'Complete') & (df['Waiting Days'] < 0), 'Waiting Days'] = np.nan

    # --- 2. Filter Short Waits ---
    short_wait_mask = (df['Case Status'] == 'Complete') & (df['Waiting Days'] < MIN_WAITING_DAYS)
    dropped_short_waits = short_wait_mask.sum()

    if dropped_short_waits > 0:
        print(f"Dropped {dropped_short_waits} complete cases with waiting days < {MIN_WAITING_DAYS}.")
        df = df[~short_wait_mask]

    return df

def sanitize_filename(name):
    s = str(name).strip().replace(' ', '_').replace(',', '_')
    return re.sub(r'(?u)[^-\w.]', '', s)

def plot_combined_graph(df, date_col_name, group_name, visa_label):
    """
    Generates a combined dual-axis graph:
    - Bar (Left Axis): Count of Pending vs Complete cases
    - Line (Right Axis): Average Waiting Days
    Groups by INTERVAL_DAYS.
    """
    # Create a local copy to manipulate index
    temp_df = df.copy()

    # Drop NaT in the grouping column so resampling works
    temp_df = temp_df.dropna(subset=[date_col_name])

    if temp_df.empty:
        return

    # Set index to date column for resampling
    temp_df.set_index(date_col_name, inplace=True)

    # Define Resampler
    grouper = temp_df.groupby([pd.Grouper(freq=f'{INTERVAL_DAYS}D'), 'Case Status'])

    # Aggregation
    # We want count of rows for bar, and mean of waiting days for line
    agg_df = grouper.agg(
        Count=('Visa Type', 'size'),
        AvgWait=('Waiting Days', 'mean')
    ).unstack(fill_value=0) # Unstack 'Case Status' to columns

    # agg_df structure: MultiIndex columns: (Count, Complete), (Count, Pending), (AvgWait, Complete), ...

    # Flatten columns for easier access
    # e.g. Count_Complete, Count_Pending, AvgWait_Complete
    agg_df.columns = ['_'.join(col).strip() for col in agg_df.columns.values]

    # Ensure columns exist even if 0
    for col in ['Count_Complete', 'Count_Pending', 'AvgWait_Complete']:
        if col not in agg_df.columns:
            agg_df[col] = 0

    # If grouping by Complete Date, 'Pending' doesn't technically exist on that timeline
    # (since they have no complete date). So Count_Pending will likely be 0 or irrelevant.
    if 'Complete' in group_name:
        bars_to_plot = ['Count_Complete']
        bar_colors = ['green']
        bar_labels = ['Complete']
    else:
        bars_to_plot = ['Count_Complete', 'Count_Pending']
        bar_colors = ['green', 'orange']
        bar_labels = ['Complete', 'Pending']

    # --- Plotting ---
    fig, ax1 = plt.subplots(figsize=(14, 7))

    # Plot Bars (Case Counts) on Left Axis
    # Align='center', width needs to be slightly less than interval to show gaps
    width_days = max(1, INTERVAL_DAYS * 0.8)

    # Pandas plot handles dates on x-axis well
    ax1.bar(agg_df.index, agg_df[bars_to_plot[0]], width=width_days, label=bar_labels[0], color=bar_colors[0], alpha=0.6)

    if len(bars_to_plot) > 1:
        # Stack the second bar
        ax1.bar(agg_df.index, agg_df[bars_to_plot[1]], width=width_days, bottom=agg_df[bars_to_plot[0]],
                label=bar_labels[1], color=bar_colors[1], alpha=0.6)

    # Bar Annotations (Counts)
    # Calculate totals for top-of-bar annotation
    totals = agg_df[bars_to_plot].sum(axis=1)
    for date, total in totals.items():
        if total > 0:
            ax1.annotate(f'{int(total)}',
                         (date, total),
                         xytext=(0, 5), textcoords='offset points',
                         ha='center', fontsize=8, color='black')

    ax1.set_xlabel(f'{group_name} (Interval: {INTERVAL_DAYS} Days)')
    ax1.set_ylabel('Number of Cases (Bars)', color='black')
    ax1.tick_params(axis='y', labelcolor='black')
    ax1.legend(loc='upper left')

    # Plot Line (Wait Time) on Right Axis
    ax2 = ax1.twinx()

    # Filter out 0 wait times (which happen if no completed cases in that bin) for cleaner line
    line_data = agg_df['AvgWait_Complete'].replace(0, np.nan)

    ax2.plot(agg_df.index, line_data, color='blue', marker='o', linewidth=2, label='Avg Waiting Days')

    # Line Annotations
    for date, val in line_data.items():
        if pd.notna(val):
            ax2.annotate(f'{val:.1f}',
                         (date, val),
                         xytext=(0, -15), textcoords='offset points',
                         ha='center', fontsize=9, color='blue', weight='bold')

    ax2.set_ylabel('Avg Waiting Days (Line)', color='blue')
    ax2.tick_params(axis='y', labelcolor='blue')
    ax2.legend(loc='upper right')

    plt.title(f'Cases & Waiting Time by {group_name}\n({visa_label}, >{START_DATE}, Interval={INTERVAL_DAYS}d)')

    # Format X-Axis Date
    ax1.xaxis.set_major_formatter(mdates.DateFormatter('%Y-%m-%d'))

    # Logic to maximize label density without overlapping too much
    # For the default 6-year range, MonthLocator(interval=1) gives ~72 labels which fits nicely with 90deg rotation
    # We use a safety check for very long ranges
    data_span_days = (agg_df.index.max() - agg_df.index.min()).days
    if data_span_days < 3000: # Approx 8 years
        ax1.xaxis.set_major_locator(mdates.MonthLocator(interval=1))
    else:
        # Fallback for extremely long periods
        ax1.xaxis.set_major_locator(mdates.YearLocator())

    # Rotate 90 degrees to fit dense labels
    plt.setp(ax1.xaxis.get_majorticklabels(), rotation=90, ha='center', fontsize=8)

    plt.grid(True, linestyle='--', alpha=0.3)
    plt.tight_layout()

    # Save
    safe_label = sanitize_filename(visa_label)
    safe_group = sanitize_filename(group_name)
    filename = f"combined_{safe_label}_{safe_group}_{INTERVAL_DAYS}d.png"
    filepath = os.path.join(OUTPUT_DIR, filename)

    plt.savefig(filepath)
    plt.close()
    print(f"  Saved plot: {filepath}")

def filter_data_by_visa(df, visa_group):
    if visa_group == 'ALL' or visa_group is None:
        return df, "All Visa Types"

    df['Visa Type Clean'] = df['Visa Type'].astype(str).str.strip()
    mask = df['Visa Type Clean'].isin(visa_group)
    filtered_df = df[mask].copy()
    label = ", ".join(visa_group)
    return filtered_df, label

def main():
    file_path = 'checkee_data.xlsx'

    if not os.path.exists(OUTPUT_DIR):
        os.makedirs(OUTPUT_DIR)
        print(f"Created output directory: {OUTPUT_DIR}")

    print(f"Looking for file: {file_path}")
    df = load_and_clean_data(file_path)

    if df is None:
        fallback_path = 'checkee_data.xlsx - Sheet1.csv'
        if os.path.exists(fallback_path) and not os.path.exists(file_path):
             print(f"XLSX not found, trying fallback CSV: {fallback_path}")
             df = load_and_clean_data(fallback_path)

    if df is None:
        return

    print(f"Total valid records loaded: {len(df)}")
    print("-" * 30)

    for group in VISA_GROUPS_TO_ANALYZE:
        current_df, label = filter_data_by_visa(df, group)

        print(f"Processing Group: {label} (Records: {len(current_df)})")

        if len(current_df) == 0:
            print(f"  No data for {label}, skipping.")
            continue

        # 1. Combined Graph by Check Date
        plot_combined_graph(current_df, 'Check Date Obj', 'Check Date', label)

        # 2. Combined Graph by Complete Date
        plot_combined_graph(current_df, 'Complete Date Obj', 'Complete Date', label)

        print("-" * 30)

if __name__ == "__main__":
    main()```